R和Python都是数据分析利器,最好能一起使用,发挥各自的优势。
在Jupyter中,通常是默认支持Python的,如何配置才能让R也能运行呢?
配置步骤
step 1
安装好R软件,打开命令行,输入R回车,调出R环境
R
在R环境中运行
install.packages(c('repr', 'IRdisplay', 'evaluate', 'crayon', 'pbdZMQ', 'devtools', 'uuid', 'digest'))
step 2
继续在在R环境中运行
devtools::install_github('IRkernel/IRkernel')
step 3
继续在R环境中运行
IRkernel::installspec(user=FALSE)
调用Jupyter
重新打开命令行,执行
jupyter notebook
弹出的界面中拥有了R的kernel
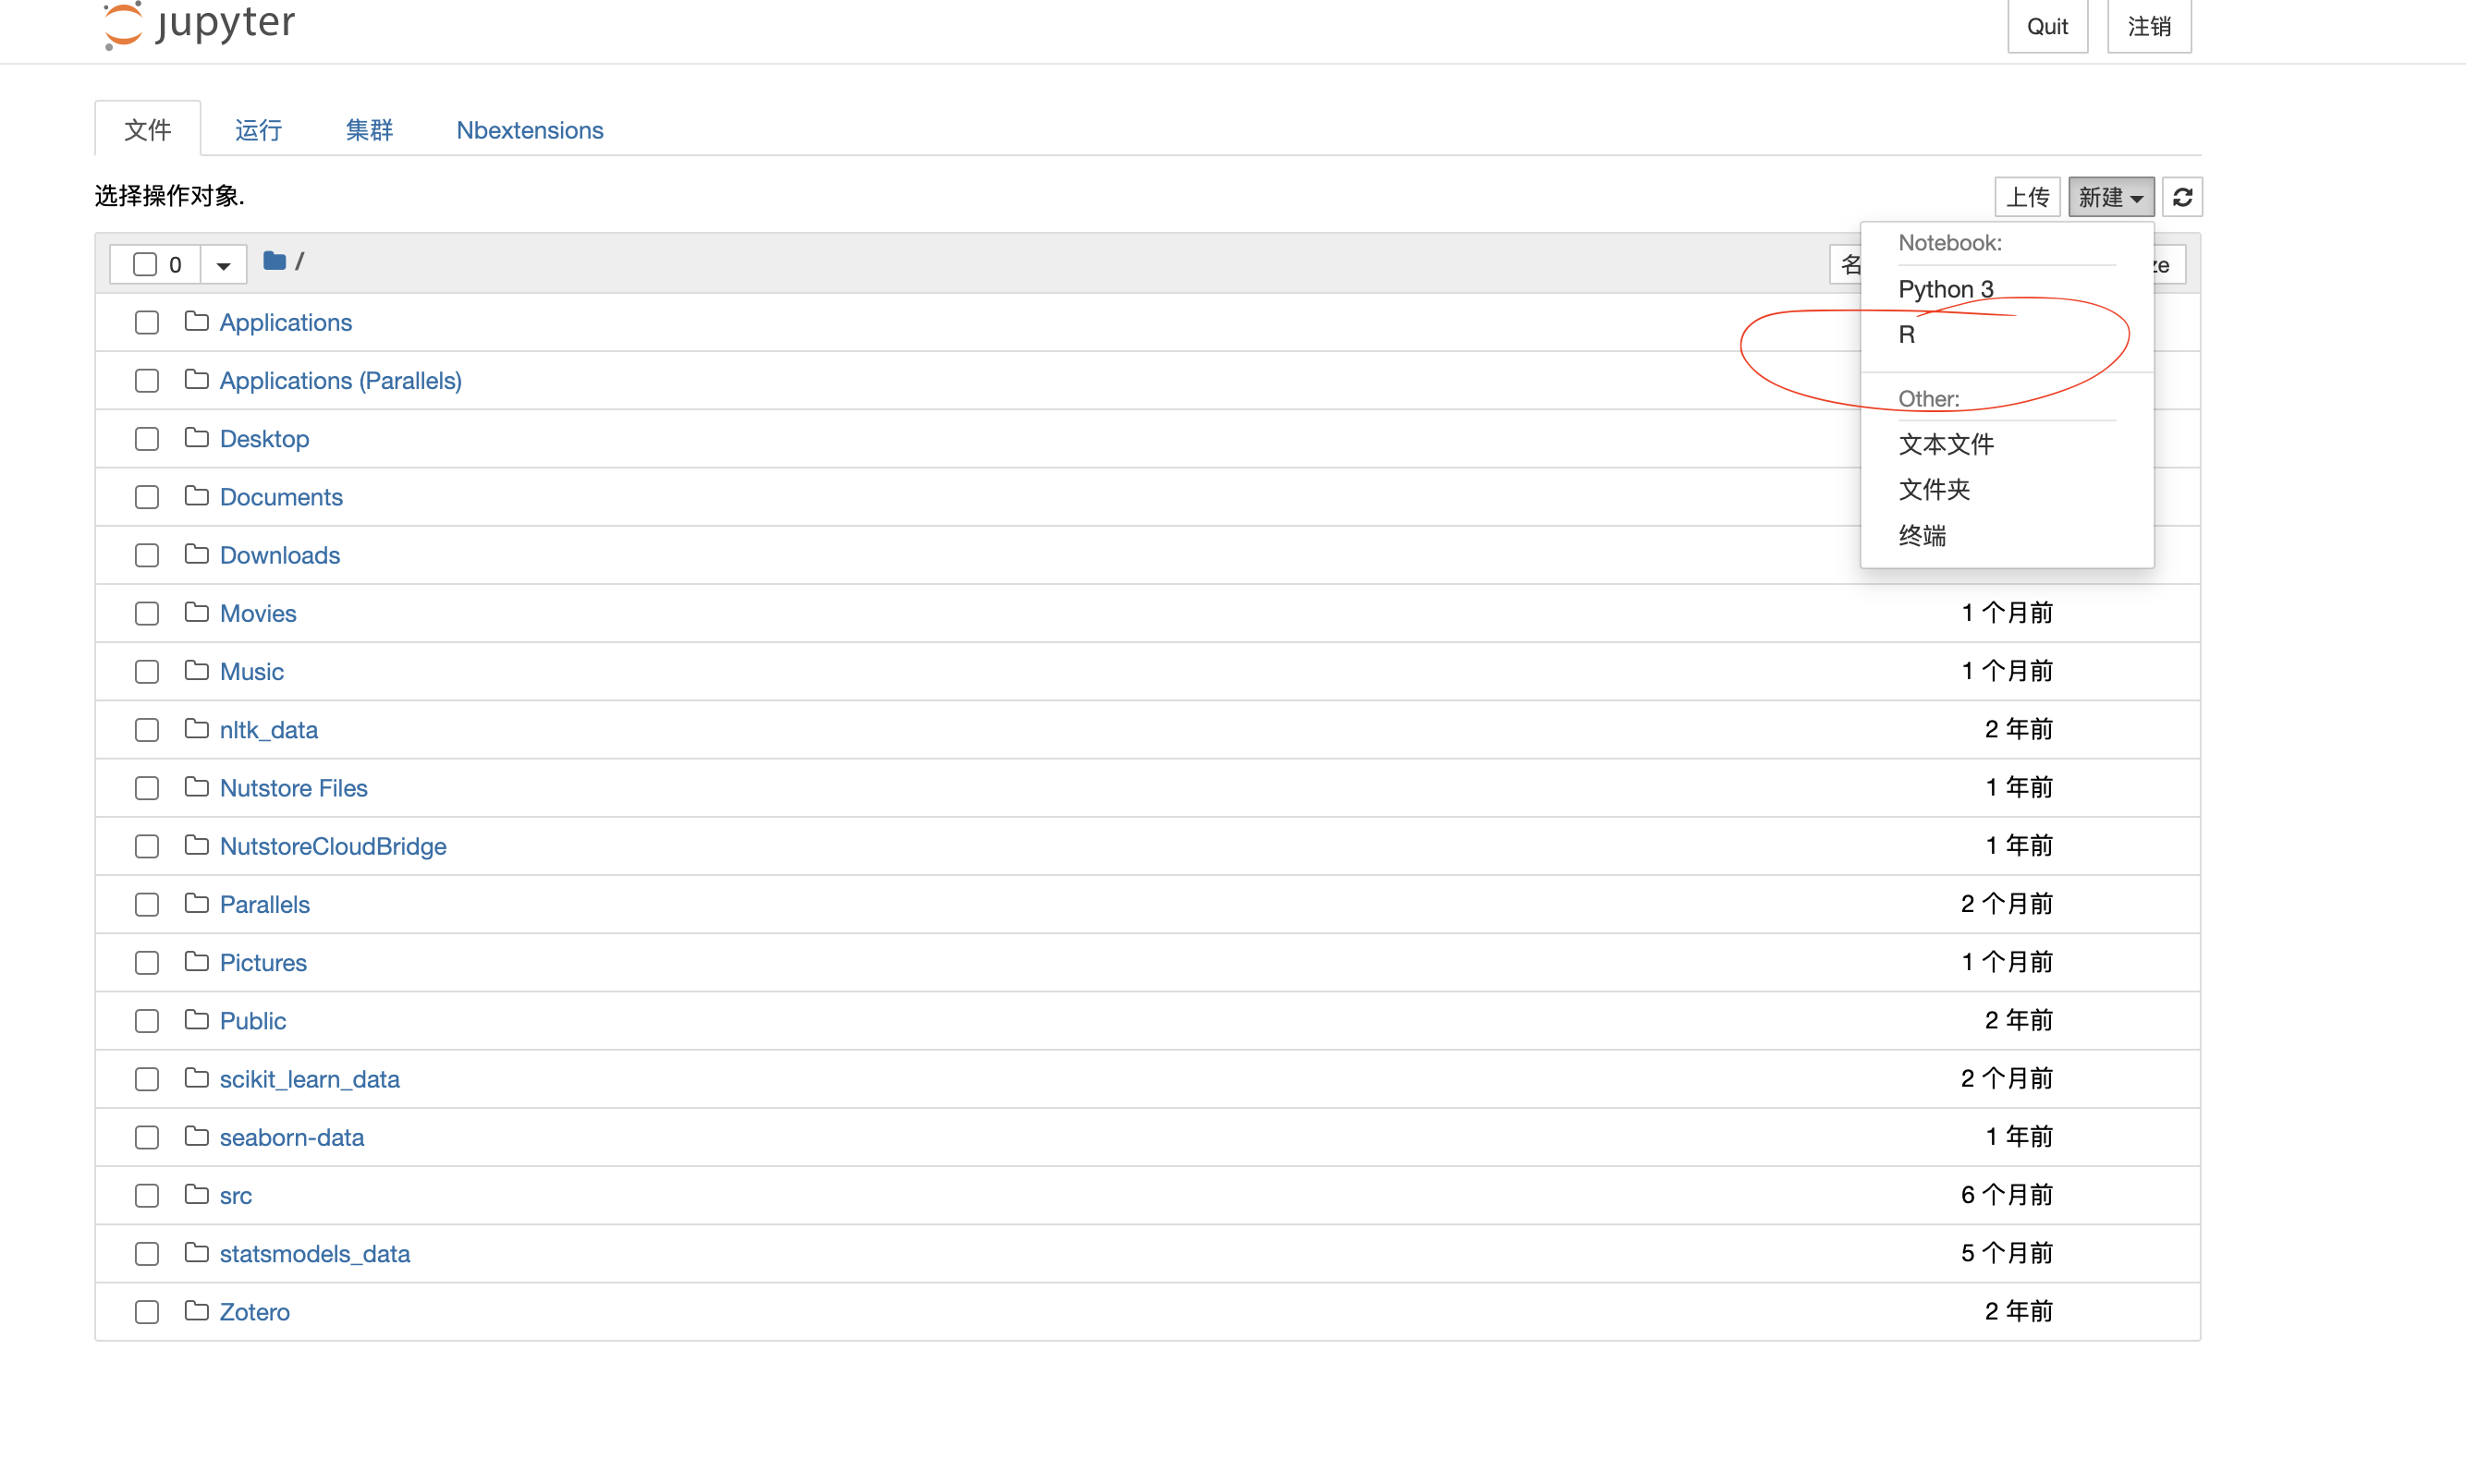
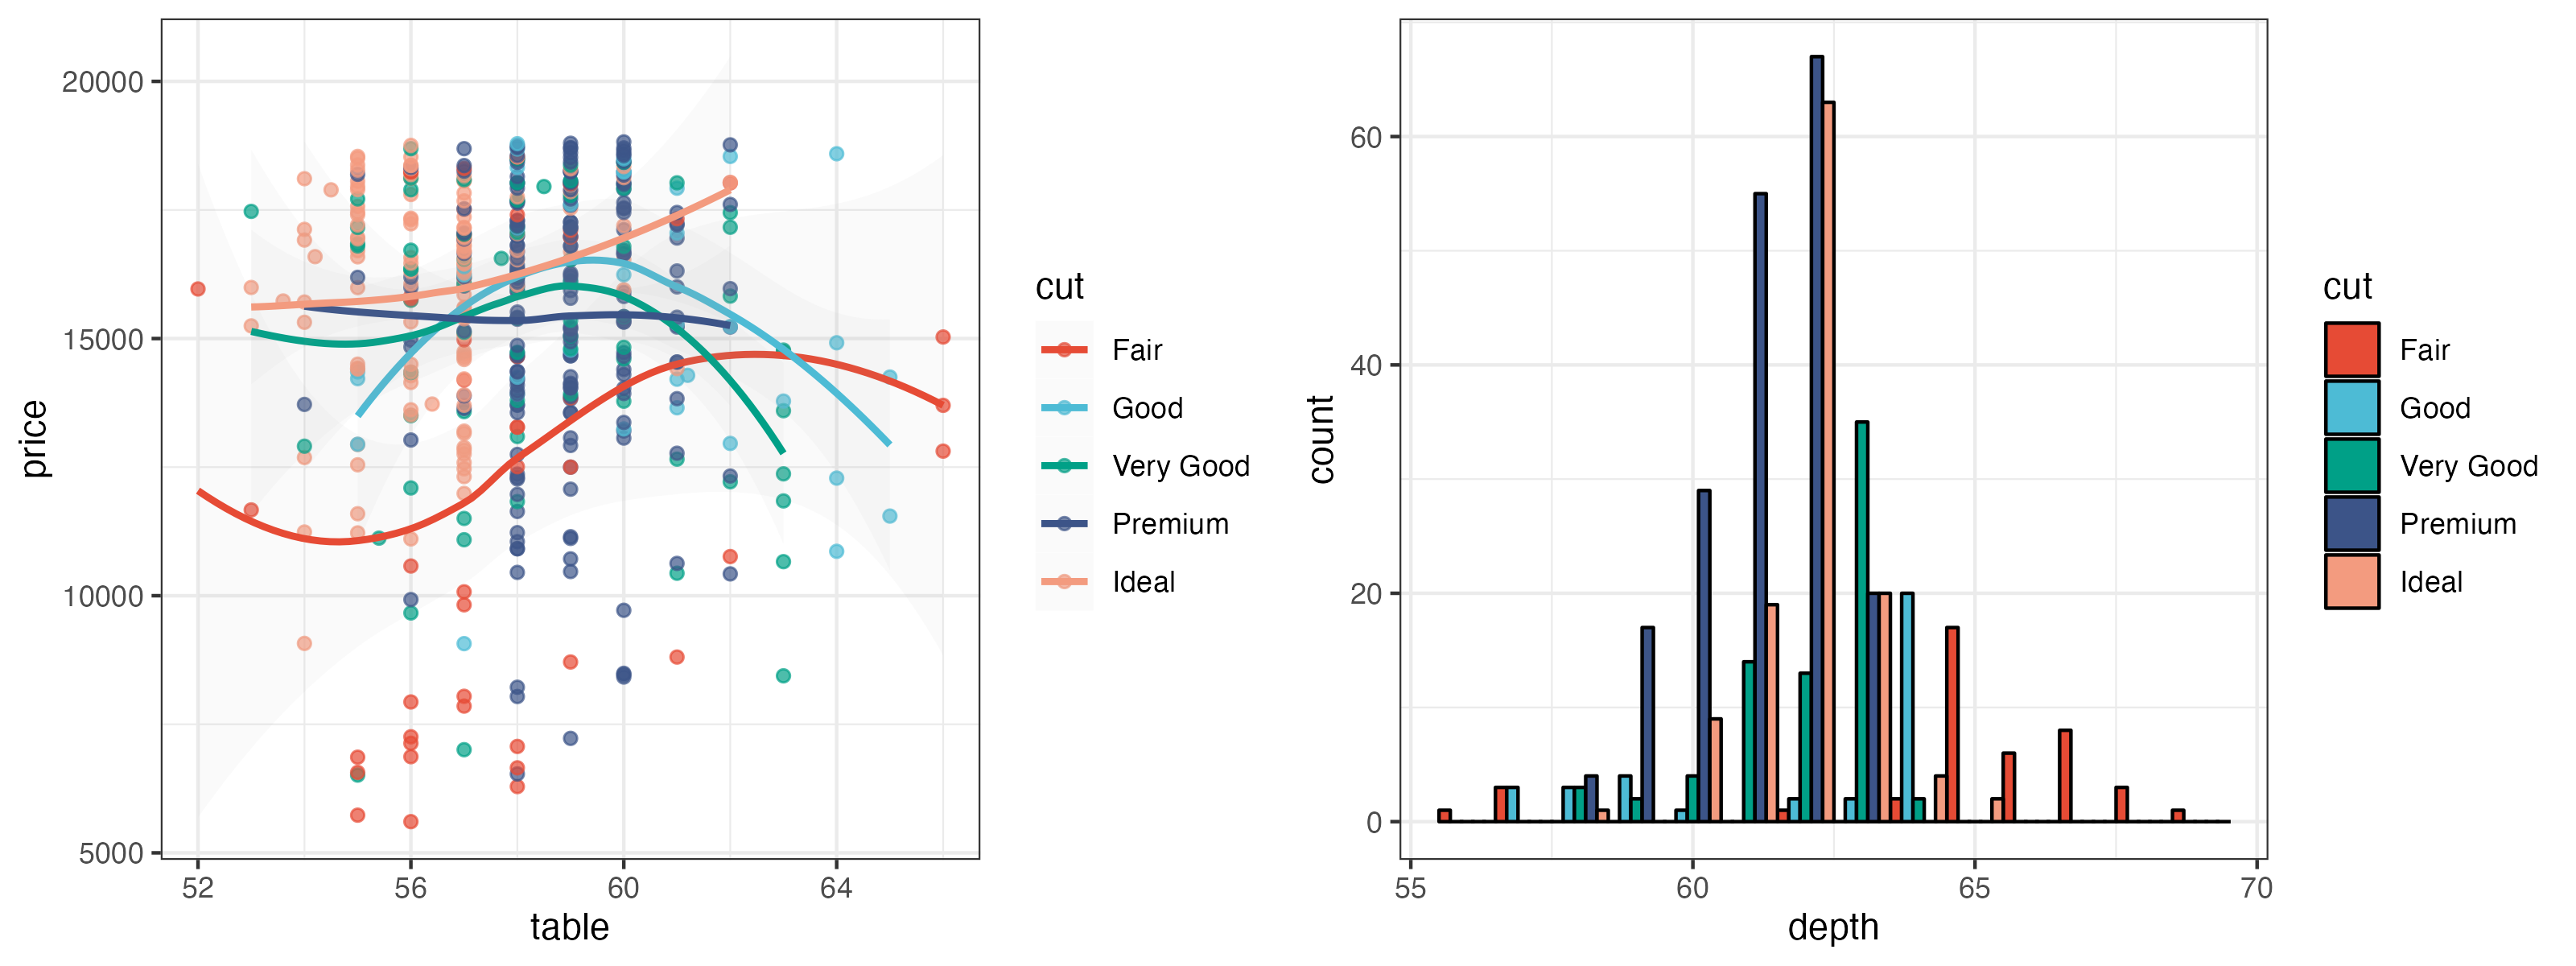
新建一个R的jupyter文件,运行下方代码
library("ggsci")
library("ggplot2")
library("gridExtra")

data("diamonds")

p1 <- ggplot(
  subset(diamonds, carat >= 2.2),
  aes(x = table, y = price, colour = cut)
) +
  geom_point(alpha = 0.7) +
  geom_smooth(method = "loess", alpha = 0.05, size = 1, span = 1) +
  theme_bw()

p2 <- ggplot(
  subset(diamonds, carat > 2.2 & depth > 55 & depth < 70),
  aes(x = depth, fill = cut)
) +
  geom_histogram(colour = "black", binwidth = 1, position = "dodge") +
  theme_bw()


p1_npg <- p1 + scale_color_npg()
p2_npg <- p2 + scale_fill_npg()
grid.arrange(p1_npg, p2_npg, ncol = 2)
Run