
使用pyecharts绘制社交网络关系图,直接上代码。
代码
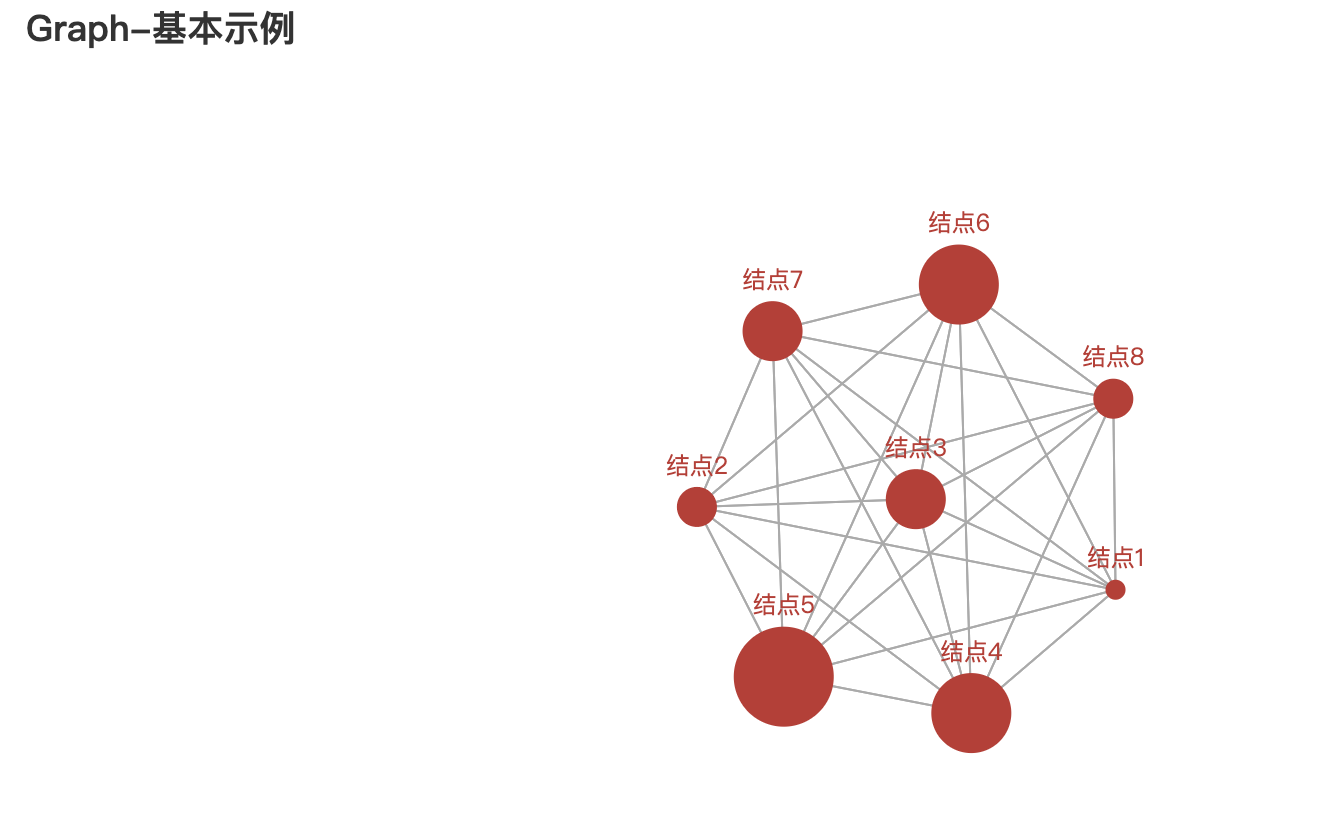
base
from pyecharts import options as opts
from pyecharts.charts import Graph

nodes = [
    {"name": "结点1", "symbolSize": 10},
    {"name": "结点2", "symbolSize": 20},
    {"name": "结点3", "symbolSize": 30},
    {"name": "结点4", "symbolSize": 40},
    {"name": "结点5", "symbolSize": 50},
    {"name": "结点6", "symbolSize": 40},
    {"name": "结点7", "symbolSize": 30},
    {"name": "结点8", "symbolSize": 20},
]
links = []
for i in nodes:
    for j in nodes:
        links.append({"source": i.get("name"), "target": j.get("name")})


(
    Graph()
    .add("", nodes, links, repulsion=8000)
    .set_global_opts(title_opts=opts.TitleOpts(title="Graph-基本示例"))
    .render("graph_base.html")
)
Run
import json
from pyecharts import options as opts
from pyecharts.charts import Graph

with open("data/weibo.json", "r", encoding="utf-8") as f:
    j = json.load(f)
    nodes, links, categories, cont, mid, userl = j


(
    Graph()
    .add(
        "",
        nodes,
        links,
        categories,
        repulsion=50,
        linestyle_opts=opts.LineStyleOpts(curve=0.2),
        label_opts=opts.LabelOpts(is_show=False),
    )
    .set_global_opts(
        legend_opts=opts.LegendOpts(is_show=False),
        title_opts=opts.TitleOpts(title="Graph-微博转发关系图"),
    )
    .render("graph_weibo.html")
)
Run

npm
import pyecharts.options as opts
from pyecharts.charts import Graph

"""
Gallery 使用 pyecharts 1.1.0
参考地址: https://echarts.apache.org/examples/editor.html?c=graph-npm

目前无法实现的功能:

1、暂无
"""


with open("data/npmdepgraph.min10.json", "r", encoding="utf-8") as f:
    data = json.load(f)


nodes = [
    {
        "x": node["x"],
        "y": node["y"],
        "id": node["id"],
        "name": node["label"],
        "symbolSize": node["size"],
        "itemStyle": {"normal": {"color": node["color"]}},
    }
    for node in data["nodes"]
]

edges = [
    {"source": edge["sourceID"], "target": edge["targetID"]} for edge in data["edges"]
]


(
    Graph(init_opts=opts.InitOpts(width="1600px", height="800px"))
    .add(
        series_name="",
        nodes=nodes,
        links=edges,
        layout="none",
        is_roam=True,
        is_focusnode=True,
        label_opts=opts.LabelOpts(is_show=False),
        linestyle_opts=opts.LineStyleOpts(width=0.5, curve=0.3, opacity=0.7),
    )
    .set_global_opts(title_opts=opts.TitleOpts(title="NPM Dependencies"))
    .render("npm_dependencies.html")
)
Run