
代码获取
Kaggle是个很棒的地方,对于数据科学家和机器学习工程师来说,这是一个知识的金矿。可以在同一地点找到由本领域专家带来的高质量,高效,可重现,很棒的代码。自推出以来,它已经举办了164场比赛。这些比赛吸引了来自世界各地的专家和专家加入该平台。结果,每场比赛以及Kaggle提供的大量开源数据集都有许多高质量的笔记本和脚本。
在数据科学之旅的开始,我将去Kaggle查找数据集以练习我的技能。每当我查看其他内核时,我都会对代码的复杂性感到不知所措,然后马上回避。
但是现在,我发现自己花费了大量时间阅读其他笔记本并提交竞赛文件。有时候,有些东西值得您度过整个周末。有时,我会发现简单但致命的有效代码技巧和最佳实践,这些技巧和最佳实践只能通过观察其他专家来学习。
在整个系列中,您会发现我在典型的数据科学工作流程中可能有用的任何内容,包括与通用库相关的代码快捷方式,Kaggle的顶级行业专家遵循的最佳实践等,这些都是我在学习过程中学到的。
1. 只绘制相关系数矩阵的下三角部分
好的相关矩阵可以说明数据集中目标变量之间的相关性
import pandas as pd
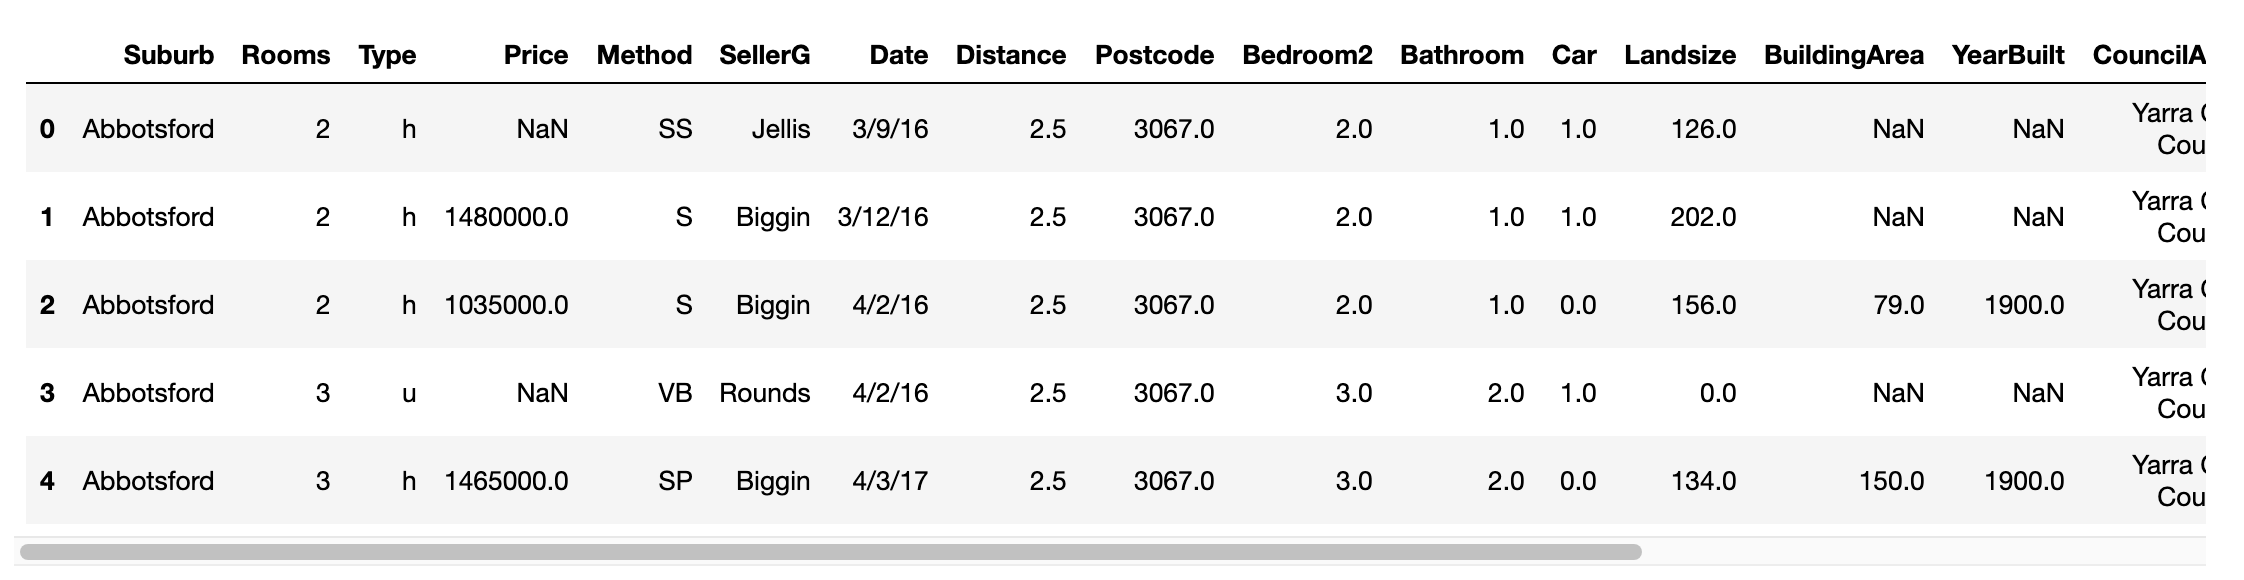
df = pd.read_csv('data/melbourne_housing_raw.csv')
df.head()
import seaborn as sns
import matplotlib.pyplot as plt

plt.figure(figsize=(16, 12))

cmap = sns.diverging_palette(250, 15, s=75, l=40,
                             n=9, center="light", as_cmap=True)

sns.heatmap(df.corr(), center=0, annot=True,
             fmt='.2f', square=True, cmap=cmap)

plt.show()
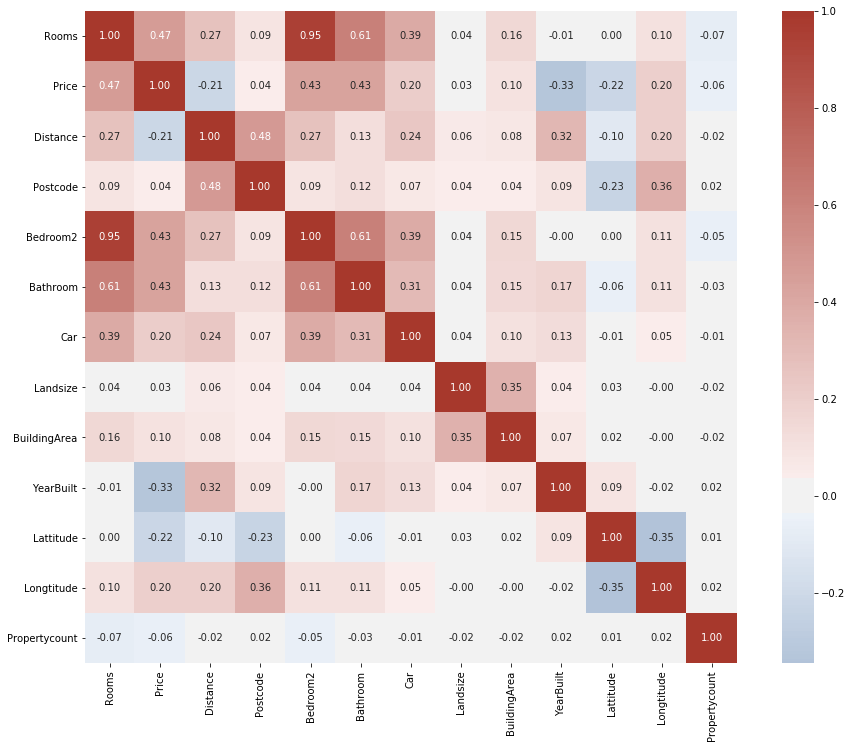
但上图中,数据集中存在大量的特征,导致相似矩阵过于庞大,让人看起来不知所措。
相关矩阵大部分沿主对角线对称,因此它们包含重复数据。 同样,对角线本身也没有用。 让我们看看如何只绘制有用的一半:
import numpy as np

# 计算相关系数
matrix = df.corr()

# 创建遮罩(为了只显示下三角)
mask = np.triu(np.ones_like(matrix, dtype=bool))

# 定制调色板
cmap = sns.diverging_palette(250, 15, s=75, l=40,
                             n=9, center="light", as_cmap=True)

# 设定图片尺寸
plt.figure(figsize=(16, 12))

# 绘制相似矩阵热力图
sns.heatmap(matrix, mask=mask, center=0, annot=True,
             fmt='.2f', square=True, cmap=cmap)

plt.show()
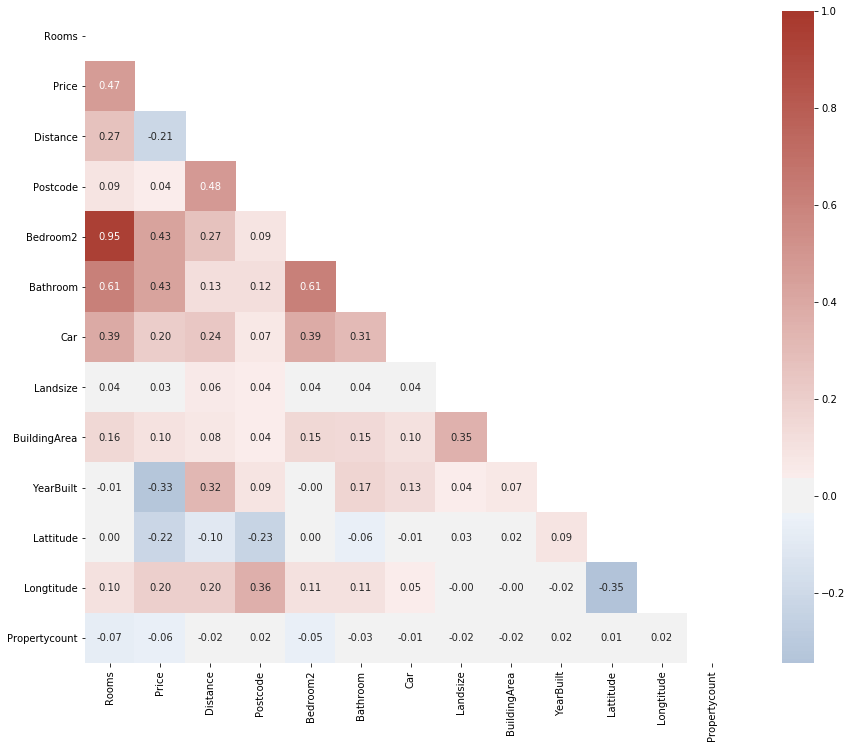
由此产生的可视化图更容易解释并且没有视觉干扰干扰。
- 首先,我们使用DataFrame的.corr方法构建相关矩阵。
- 然后,我们使用dtype设置为bool的np.ones_like函数来创建一个True矩阵,其形状与DataFrame相同:
np.ones((5, 5))
array([[1., 1., 1., 1., 1.],
       [1., 1., 1., 1., 1.],
       [1., 1., 1., 1., 1.],
       [1., 1., 1., 1., 1.],
       [1., 1., 1., 1., 1.]])
np.ones_like(np.ones((4, 4)), dtype=bool)
array([[ True,  True,  True,  True],
       [ True,  True,  True,  True],
       [ True,  True,  True,  True],
       [ True,  True,  True,  True]])
将布尔方阵传递给Numpy的.triu函数,该函数将返回一个二维布尔蒙版,其中包含矩阵下三角的False值。
np.triu(np.ones_like(np.ones((4, 4)), dtype=bool))
array([[ True,  True,  True,  True],
       [False,  True,  True,  True],
       [False, False,  True,  True],
       [False, False, False,  True]])
然后,我们可以将其传递给Seaborn的heatmap函数,以根据此蒙版对矩阵进行可视化
ns.heatmap(matrix, mask=mask, center=0, annot=True,
               fmt='.2f', square=True, cmap=cmap)
2. value_counts考虑缺失值
使用value_counts时,可将dropna设置为False来查看任何列中缺失值的比例。通过确定缺失值的比例,可以决定是否丢弃含有缺失值的记录。
#字段CouncilArea的数据分布情况
df.CouncilArea.value_counts(dropna=False, normalize=True).head()
Boroondara City Council    0.105431
Darebin City Council       0.081791
Moreland City Council      0.060877
Glen Eira City Council     0.057549
Melbourne City Council     0.056000
Name: CouncilArea, dtype: float64
但是,如果要查看所有列中缺失值的比例,则value_counts不是最佳选择。 相反,您可以执行以下操作:
-
首先,通过将缺失值的数量除以DataFrame的长度来找到比例。
-
然后,您可以过滤掉0%的列,即i。 e。 只选择缺少值的列。
missing_props = df.isna().sum() / len(df)

missing_props[missing_props > 0].sort_values(ascending=False)
BuildingArea     0.605761
YearBuilt        0.553863
Landsize         0.338813
Car              0.250394
Bathroom         0.235993
Bedroom2         0.235735
Longtitude       0.228821
Lattitude        0.228821
Price            0.218321
Propertycount    0.000086
Regionname       0.000086
CouncilArea      0.000086
Postcode         0.000029
Distance         0.000029
dtype: float64
3. 使用Pandas的Styler
我们中的许多人从未意识到pandas的巨大潜力。pandas的一个被低估且经常被忽视的功能是其对DataFrames进行样式设置的能力。 使用pandas DataFrames的.style属性,可以将条件设计和样式应用于它们。
作为第一个示例,让我们看看如何根据每个单元格的值来更改背景颜色:
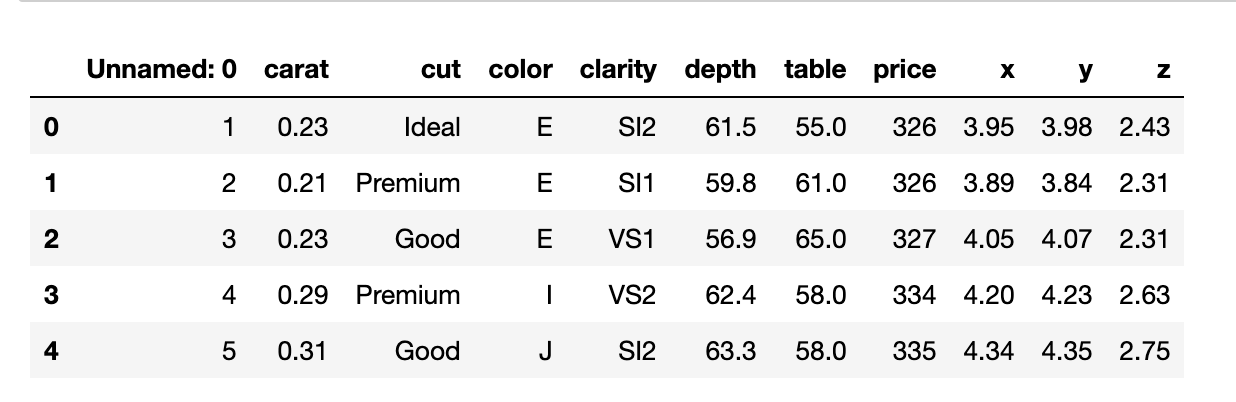
diamonds = pd.read_csv('data/diamonds.csv')
diamonds.head()
pd.crosstab(diamonds.cut, diamonds.clarity).style.background_gradient(cmap='rocket_r')
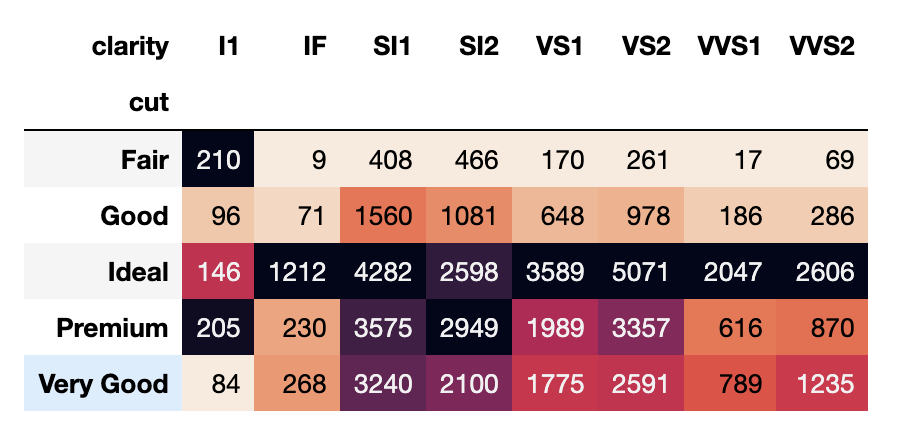
几乎没有使用Seaborn的热图功能的热图。 在这里,我们使用pd.crosstab对钻石切割(cut)和净度(clarity)的每种组合进行计数。
将.style.background_gradient与调色板配合使用,您可以轻松地发现哪种组合出现得最多。 仅从上面的DataFrame中,我们可以看到大多数钻石都是“ VS2”净度类型。
我们甚至可以通过在交叉表中找到每种钻石切割cut和净度clarity组合的平均价格来进一步做到这一点:
pd.crosstab(diamonds.cut, diamonds.clarity, aggfunc=np.mean, values=diamonds.price).style.background_gradient(cmap='rocket_r')
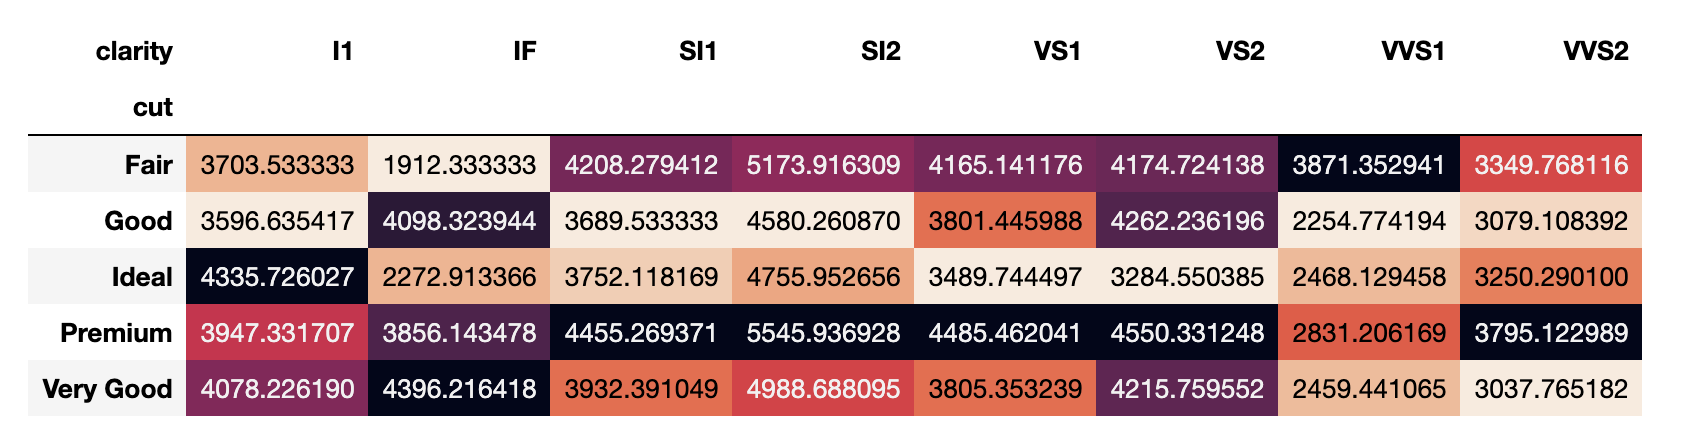
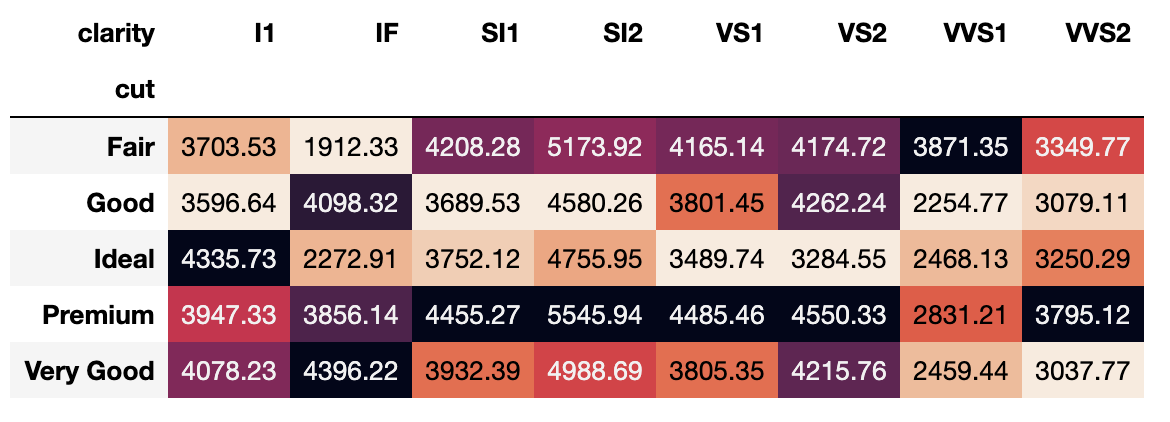
通过将.format方法与格式字符串{:.2f}链接起来,我们指定了2个浮点数的精度。
agg_prices = pd.crosstab(diamonds.cut, diamonds.clarity, aggfunc=np.mean, values=diamonds.price).style.background_gradient(cmap='rocket_r')

agg_prices.format('{:.2f}')
4. matplotlib默认全局设置
在进行探索性数据分析时,您可能想对所有绘图应用自定义调色板,对刻度标签使用更大的字体,更改图例的位置,使用固定的图形大小等。
对绘图自定义参数的更改是一项非常无聊,重复且耗时的任务。 幸运的是,您可以使用Matplotlib的rcParams为绘图设置全局配置。
rcParams只是一个普通的Python字典,其中包含Matplotlib的默认设置:
from matplotlib import rcParams
import warnings
warnings.filterwarnings('ignore')

rcParams
RcParams({'_internal.classic_mode': False,
          'agg.path.chunksize': 0,
          'animation.avconv_args': [],
          'animation.avconv_path': 'avconv',
          'animation.bitrate': -1,
          'animation.codec': 'h264',
          'animation.convert_args': [],
          'animation.convert_path': 'convert',
          'animation.embed_limit': 20.0,
          'animation.ffmpeg_args': [],
          'animation.ffmpeg_path': 'ffmpeg',
          'animation.frame_format': 'png',
          'animation.html': 'none',
          'animation.html_args': [],
          'animation.writer': 'ffmpeg',
          'axes.autolimit_mode': 'data',
          'axes.axisbelow': 'line',
          'axes.edgecolor': 'black',
          'axes.facecolor': 'white',
          'axes.formatter.limits': [-7, 7],
          'axes.formatter.min_exponent': 0,
          'axes.formatter.offset_threshold': 4,
          'axes.formatter.use_locale': False,
          'axes.formatter.use_mathtext': False,
          'axes.formatter.useoffset': True,
          'axes.grid': False,
          'axes.grid.axis': 'both',
          'axes.grid.which': 'major',
          'axes.labelcolor': 'black',
          'axes.labelpad': 4.0,
          'axes.labelsize': 'medium',
          'axes.labelweight': 'normal',
          'axes.linewidth': 0.8,
          'axes.prop_cycle': cycler('color', ['#1f77b4', '#ff7f0e', '#2ca02c', '#d62728', '#9467bd', '#8c564b', '#e377c2', '#7f7f7f', '#bcbd22', '#17becf']),
          'axes.spines.bottom': True,
          'axes.spines.left': True,
          'axes.spines.right': True,
          'axes.spines.top': True,
          'axes.titlepad': 6.0,
          'axes.titlesize': 'large',
          'axes.titleweight': 'normal',
          'axes.unicode_minus': True,
          'axes.xmargin': 0.05,
          'axes.ymargin': 0.05,
          'axes3d.grid': True,
          'backend': 'module://ipykernel.pylab.backend_inline',
          'backend_fallback': True,
          'boxplot.bootstrap': None,
          'boxplot.boxprops.color': 'black',
          'boxplot.boxprops.linestyle': '-',
          'boxplot.boxprops.linewidth': 1.0,
          'boxplot.capprops.color': 'black',
          'boxplot.capprops.linestyle': '-',
          'boxplot.capprops.linewidth': 1.0,
          'boxplot.flierprops.color': 'black',
          'boxplot.flierprops.linestyle': 'none',
          'boxplot.flierprops.linewidth': 1.0,
          'boxplot.flierprops.marker': 'o',
          'boxplot.flierprops.markeredgecolor': 'black',
          'boxplot.flierprops.markeredgewidth': 1.0,
          'boxplot.flierprops.markerfacecolor': 'none',
          'boxplot.flierprops.markersize': 6.0,
          'boxplot.meanline': False,
          'boxplot.meanprops.color': 'C2',
          'boxplot.meanprops.linestyle': '--',
          'boxplot.meanprops.linewidth': 1.0,
          'boxplot.meanprops.marker': '^',
          'boxplot.meanprops.markeredgecolor': 'C2',
          'boxplot.meanprops.markerfacecolor': 'C2',
          'boxplot.meanprops.markersize': 6.0,
          'boxplot.medianprops.color': 'C1',
          'boxplot.medianprops.linestyle': '-',
          'boxplot.medianprops.linewidth': 1.0,
          'boxplot.notch': False,
          'boxplot.patchartist': False,
          'boxplot.showbox': True,
          'boxplot.showcaps': True,
          'boxplot.showfliers': True,
          'boxplot.showmeans': False,
          'boxplot.vertical': True,
          'boxplot.whiskerprops.color': 'black',
          'boxplot.whiskerprops.linestyle': '-',
          'boxplot.whiskerprops.linewidth': 1.0,
          'boxplot.whiskers': 1.5,
          'contour.corner_mask': True,
          'contour.negative_linestyle': 'dashed',
          'datapath': '/Library/Frameworks/Python.framework/Versions/3.7/lib/python3.7/site-packages/matplotlib/mpl-data',
          'date.autoformatter.day': '%Y-%m-%d',
          'date.autoformatter.hour': '%m-%d %H',
          'date.autoformatter.microsecond': '%M:%S.%f',
          'date.autoformatter.minute': '%d %H:%M',
          'date.autoformatter.month': '%Y-%m',
          'date.autoformatter.second': '%H:%M:%S',
          'date.autoformatter.year': '%Y',
          'docstring.hardcopy': False,
          'errorbar.capsize': 0.0,
          'examples.directory': '',
          'figure.autolayout': False,
          'figure.constrained_layout.h_pad': 0.04167,
          'figure.constrained_layout.hspace': 0.02,
          'figure.constrained_layout.use': False,
          'figure.constrained_layout.w_pad': 0.04167,
          'figure.constrained_layout.wspace': 0.02,
          'figure.dpi': 72.0,
          'figure.edgecolor': (1, 1, 1, 0),
          'figure.facecolor': (1, 1, 1, 0),
          'figure.figsize': [6.0, 4.0],
          'figure.frameon': True,
          'figure.max_open_warning': 20,
          'figure.subplot.bottom': 0.125,
          'figure.subplot.hspace': 0.2,
          'figure.subplot.left': 0.125,
          'figure.subplot.right': 0.9,
          'figure.subplot.top': 0.88,
          'figure.subplot.wspace': 0.2,
          'figure.titlesize': 'large',
          'figure.titleweight': 'normal',
          'font.cursive': ['Apple Chancery',
                           'Textile',
                           'Zapf Chancery',
                           'Sand',
                           'Script MT',
                           'Felipa',
                           'cursive'],
          'font.family': ['sans-serif'],
          'font.fantasy': ['Comic Sans MS',
                           'Chicago',
                           'Charcoal',
                           'Impact',
                           'Western',
                           'Humor Sans',
                           'xkcd',
                           'fantasy'],
          'font.monospace': ['DejaVu Sans Mono',
                             'Bitstream Vera Sans Mono',
                             'Computer Modern Typewriter',
                             'Andale Mono',
                             'Nimbus Mono L',
                             'Courier New',
                             'Courier',
                             'Fixed',
                             'Terminal',
                             'monospace'],
          'font.sans-serif': ['DejaVu Sans',
                              'Bitstream Vera Sans',
                              'Computer Modern Sans Serif',
                              'Lucida Grande',
                              'Verdana',
                              'Geneva',
                              'Lucid',
                              'Arial',
                              'Helvetica',
                              'Avant Garde',
                              'sans-serif'],
          'font.serif': ['DejaVu Serif',
                         'Bitstream Vera Serif',
                         'Computer Modern Roman',
                         'New Century Schoolbook',
                         'Century Schoolbook L',
                         'Utopia',
                         'ITC Bookman',
                         'Bookman',
                         'Nimbus Roman No9 L',
                         'Times New Roman',
                         'Times',
                         'Palatino',
                         'Charter',
                         'serif'],
          'font.size': 10.0,
          'font.stretch': 'normal',
          'font.style': 'normal',
          'font.variant': 'normal',
          'font.weight': 'normal',
          'grid.alpha': 1.0,
          'grid.color': '#b0b0b0',
          'grid.linestyle': '-',
          'grid.linewidth': 0.8,
          'hatch.color': 'black',
          'hatch.linewidth': 1.0,
          'hist.bins': 10,
          'image.aspect': 'equal',
          'image.cmap': 'viridis',
          'image.composite_image': True,
          'image.interpolation': 'nearest',
          'image.lut': 256,
          'image.origin': 'upper',
          'image.resample': True,
          'interactive': True,
          'keymap.all_axes': ['a'],
          'keymap.back': ['left', 'c', 'backspace', 'MouseButton.BACK'],
          'keymap.copy': ['ctrl+c', 'cmd+c'],
          'keymap.forward': ['right', 'v', 'MouseButton.FORWARD'],
          'keymap.fullscreen': ['f', 'ctrl+f'],
          'keymap.grid': ['g'],
          'keymap.grid_minor': ['G'],
          'keymap.help': ['f1'],
          'keymap.home': ['h', 'r', 'home'],
          'keymap.pan': ['p'],
          'keymap.quit': ['ctrl+w', 'cmd+w', 'q'],
          'keymap.quit_all': ['W', 'cmd+W', 'Q'],
          'keymap.save': ['s', 'ctrl+s'],
          'keymap.xscale': ['k', 'L'],
          'keymap.yscale': ['l'],
          'keymap.zoom': ['o'],
          'legend.borderaxespad': 0.5,
          'legend.borderpad': 0.4,
          'legend.columnspacing': 2.0,
          'legend.edgecolor': '0.8',
          'legend.facecolor': 'inherit',
          'legend.fancybox': True,
          'legend.fontsize': 'medium',
          'legend.framealpha': 0.8,
          'legend.frameon': True,
          'legend.handleheight': 0.7,
          'legend.handlelength': 2.0,
          'legend.handletextpad': 0.8,
          'legend.labelspacing': 0.5,
          'legend.loc': 'best',
          'legend.markerscale': 1.0,
          'legend.numpoints': 1,
          'legend.scatterpoints': 1,
          'legend.shadow': False,
          'legend.title_fontsize': None,
          'lines.antialiased': True,
          'lines.color': 'C0',
          'lines.dash_capstyle': 'butt',
          'lines.dash_joinstyle': 'round',
          'lines.dashdot_pattern': [6.4, 1.6, 1.0, 1.6],
          'lines.dashed_pattern': [3.7, 1.6],
          'lines.dotted_pattern': [1.0, 1.65],
          'lines.linestyle': '-',
          'lines.linewidth': 1.5,
          'lines.marker': 'None',
          'lines.markeredgecolor': 'auto',
          'lines.markeredgewidth': 1.0,
          'lines.markerfacecolor': 'auto',
          'lines.markersize': 6.0,
          'lines.scale_dashes': True,
          'lines.solid_capstyle': 'projecting',
          'lines.solid_joinstyle': 'round',
          'markers.fillstyle': 'full',
          'mathtext.bf': 'sans:bold',
          'mathtext.cal': 'cursive',
          'mathtext.default': 'it',
          'mathtext.fallback_to_cm': True,
          'mathtext.fontset': 'dejavusans',
          'mathtext.it': 'sans:italic',
          'mathtext.rm': 'sans',
          'mathtext.sf': 'sans',
          'mathtext.tt': 'monospace',
          'patch.antialiased': True,
          'patch.edgecolor': 'black',
          'patch.facecolor': 'C0',
          'patch.force_edgecolor': False,
          'patch.linewidth': 1.0,
          'path.effects': [],
          'path.simplify': True,
          'path.simplify_threshold': 0.1111111111111111,
          'path.sketch': None,
          'path.snap': True,
          'pdf.compression': 6,
          'pdf.fonttype': 3,
          'pdf.inheritcolor': False,
          'pdf.use14corefonts': False,
          'pgf.preamble': '',
          'pgf.rcfonts': True,
          'pgf.texsystem': 'xelatex',
          'polaraxes.grid': True,
          'ps.distiller.res': 6000,
          'ps.fonttype': 3,
          'ps.papersize': 'letter',
          'ps.useafm': False,
          'ps.usedistiller': False,
          'savefig.bbox': None,
          'savefig.directory': '~',
          'savefig.dpi': 'figure',
          'savefig.edgecolor': 'white',
          'savefig.facecolor': 'white',
          'savefig.format': 'png',
          'savefig.frameon': True,
          'savefig.jpeg_quality': 95,
          'savefig.orientation': 'portrait',
          'savefig.pad_inches': 0.1,
          'savefig.transparent': False,
          'scatter.edgecolors': 'face',
          'scatter.marker': 'o',
          'svg.fonttype': 'path',
          'svg.hashsalt': None,
          'svg.image_inline': True,
          'text.antialiased': True,
          'text.color': 'black',
          'text.hinting': 'auto',
          'text.hinting_factor': 8,
          'text.latex.preamble': '',
          'text.latex.preview': False,
          'text.latex.unicode': True,
          'text.usetex': False,
          'timezone': 'UTC',
          'tk.window_focus': False,
          'toolbar': 'toolbar2',
          'verbose.fileo': 'sys.stdout',
          'verbose.level': 'silent',
          'webagg.address': '127.0.0.1',
          'webagg.open_in_browser': True,
          'webagg.port': 8988,
          'webagg.port_retries': 50,
          'xtick.alignment': 'center',
          'xtick.bottom': True,
          'xtick.color': 'black',
          'xtick.direction': 'out',
          'xtick.labelbottom': True,
          'xtick.labelsize': 'medium',
          'xtick.labeltop': False,
          'xtick.major.bottom': True,
          'xtick.major.pad': 3.5,
          'xtick.major.size': 3.5,
          'xtick.major.top': True,
          'xtick.major.width': 0.8,
          'xtick.minor.bottom': True,
          'xtick.minor.pad': 3.4,
          'xtick.minor.size': 2.0,
          'xtick.minor.top': True,
          'xtick.minor.visible': False,
          'xtick.minor.width': 0.6,
          'xtick.top': False,
          'ytick.alignment': 'center_baseline',
          'ytick.color': 'black',
          'ytick.direction': 'out',
          'ytick.labelleft': True,
          'ytick.labelright': False,
          'ytick.labelsize': 'medium',
          'ytick.left': True,
          'ytick.major.left': True,
          'ytick.major.pad': 3.5,
          'ytick.major.right': True,
          'ytick.major.size': 3.5,
          'ytick.major.width': 0.8,
          'ytick.minor.left': True,
          'ytick.minor.pad': 3.4,
          'ytick.minor.right': True,
          'ytick.minor.size': 2.0,
          'ytick.minor.visible': False,
          'ytick.minor.width': 0.6,
          'ytick.right': False})
您可以调整每个图的任意参数设置,一般的图像设置如固定图形大小,刻度标签字体大小以及其他一些参数。
通过这种设置,可以减少很多重复的代码量
# 去掉顶部和右侧的线条Remove top and right spines
rcParams['axes.spines.top'] = False
rcParams['axes.spines.right'] = False

# 设置图的尺寸Set fixed figure size
rcParams['figure.figsize'] = [12, 9]

# 设置图片像素清晰度 Set dots per inch to 300, very high quality images
rcParams['figure.dpi'] = 300

# 设置自动调整布局Enable autolayout
rcParams['figure.autolayout'] = True

# 设置全局字号Set global fontsize
rcParams['font.style'] = 16

# 刻度字号Fontsize of ticklabels
rcParams['xtick.labelsize'] = 10
rcParams['ytick.labelsize'] = 10
5. Pandas全局设置
就像Matplotlib一样,pandas具有可以使用的全局设置。 当然,它们大多数与显示选项有关。
- get_option() - 获取pandas单个选项
- set_option() — 设置pandas单个选项
- reset_option() — 重置pandas选项值
我更喜欢显示所有的列,lets go
pd.set_option('display.max_columns', None)
df.head()
