
下载项目数据代码
地理空间数据分析已成为数据科学中的一个常见领域。对于地理空间数据科学来说也不例外。支持 GeoPandas、Shapely 和 Rasterio 等项目的社区使 Python 成为地理空间分析的首选。
Greppo:快速简单的地理空间仪表板构建方法
Greppo 是一个用于构建地理空间网络应用程序的开源 Python 框架。 它提供了可随时使用的前端和后端组件作为函数,充当前端交互组件和绑定的后端变量之间的 API。 要了解有关心智模型的更多信息,请参阅此页面。
无需太多前端、后端、Web 开发经验,您就可以在 5 分钟内使用 Python 构建和部署功能齐全的 Web 应用程序。
- GitHub存储库:https://github.com/greppo-io/greppo
- 文档:https://docs.greppo.io/
- 网站:https://greppo.io/
在本教程中,我们将使用 Greppo 在 Python 中构建地理空间仪表板。 我们将通过设置环境、安装、导入数据、为我们的仪表板放入组件并为其提供服务来工作。 您将需要了解 Python、GeoPandas 和地理空间分析的基础知识。 入门…
首先要做的是安装本文需要的 Python 第三方库。
pip install greppo geopandas
下载本教程所需的数据集。 本教程的所有数据和代码都可以在这个 GitHub 存储库中找到:greppo-demo/vector-demo(数据源:https://github.com/openpolis/geojson-italy)
编写仪表板脚本
我们首先为项目设置文件夹结构。 我将使用以下项目文件夹结构:
└── vector-demo
    ├── app.py
    ├── cities.geojson
    ├── regions.geojson
    └── roads.geojson
该应用程序的主控脚本是 app.py。
Step 0:启动服务器
启动服务器,请打开**终端(windows对应的是命令行cmd)**并按照这些说明进行操作。
首先,终端中执行cd vector_demo将工作目录切换为 (cd) 项目文件夹 vector_demo。
然后,终端执行greppo serve app.py, 启动服务器。
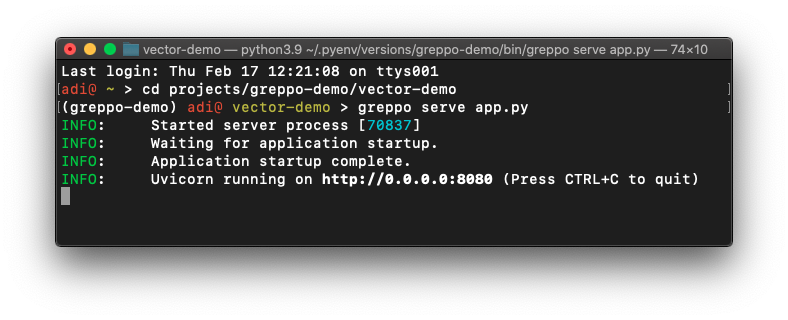
然后,您将看到 Uvicorn 服务器在指定位置(类似于链接)运行。 复制网址链接,并将其粘贴到浏览器中。 然后它将加载应用程序。 如果您对 app.py 进行了任何更改,您将在浏览器页面上看到对您的应用的更新更改。
Step 1:构建应用程序的基本脚手架。
即导入 greppo 包,并在地图中添加 base_layer。
from greppo import app

app.base_layer(
    name="Open Street Map",
    visible=True,
    url="https://{s}.tile.openstreetmap.org/{z}/{x}/{y}.png",
    subdomains=None,
    attribution='(C) OpenStreetMap contributors',
)

app.base_layer(provider="CartoDB Positron")
您需要先从 greppo 导入应用程序。 此应用程序对象将用作您的应用程序前端的接口,并为前端和后端之间的 2 路通信提供 API。
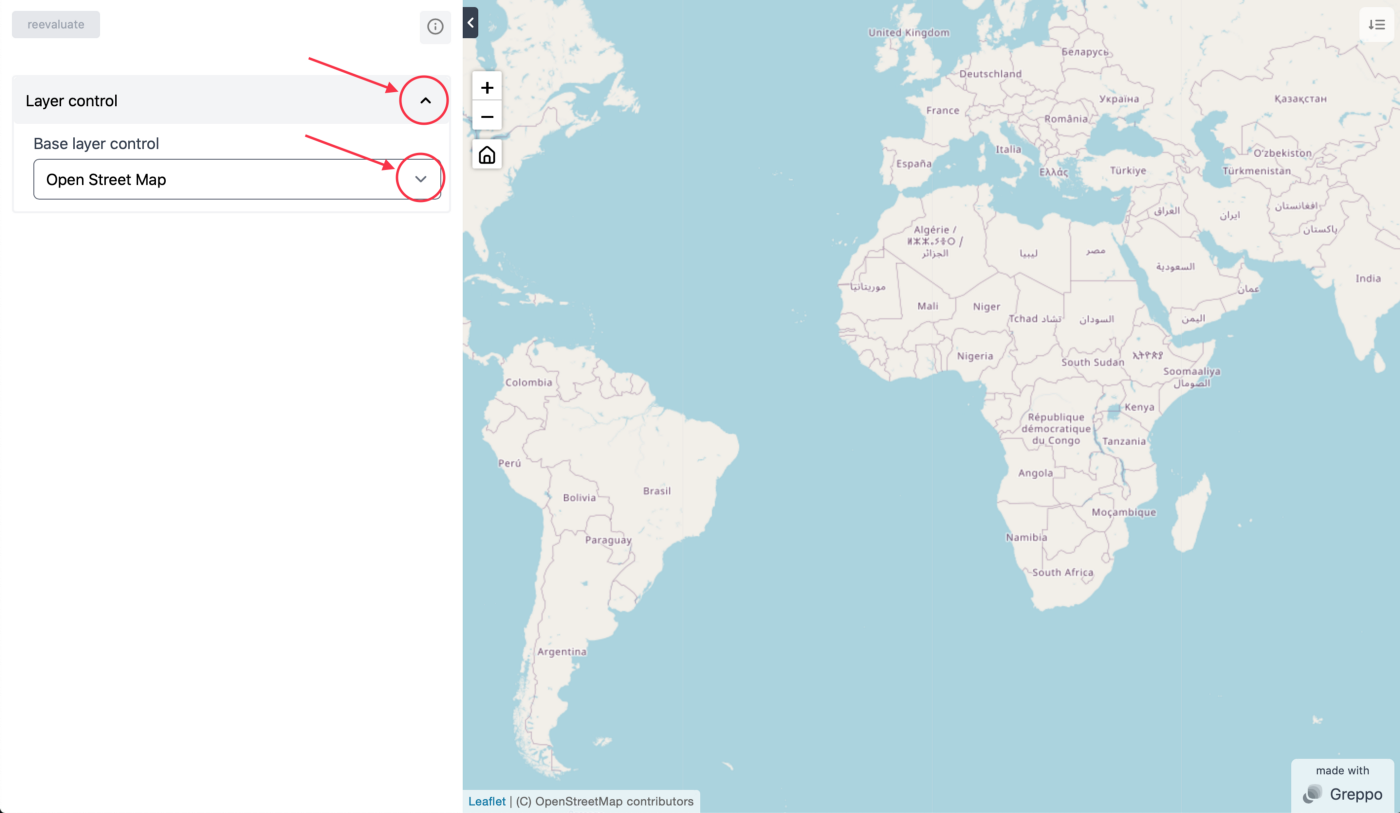
要将 base_layer 添加到您的应用程序地图,只需使用带有所需参数的应用程序 API 方法 app.base_layer()。 请参阅文档以了解什么是必需的和什么是可选的。 base_layer 方法提供了两种方法来指定基本瓦片层。 一种是使用 name 和 url 属性。 另一种方法是使用提供者的名称。
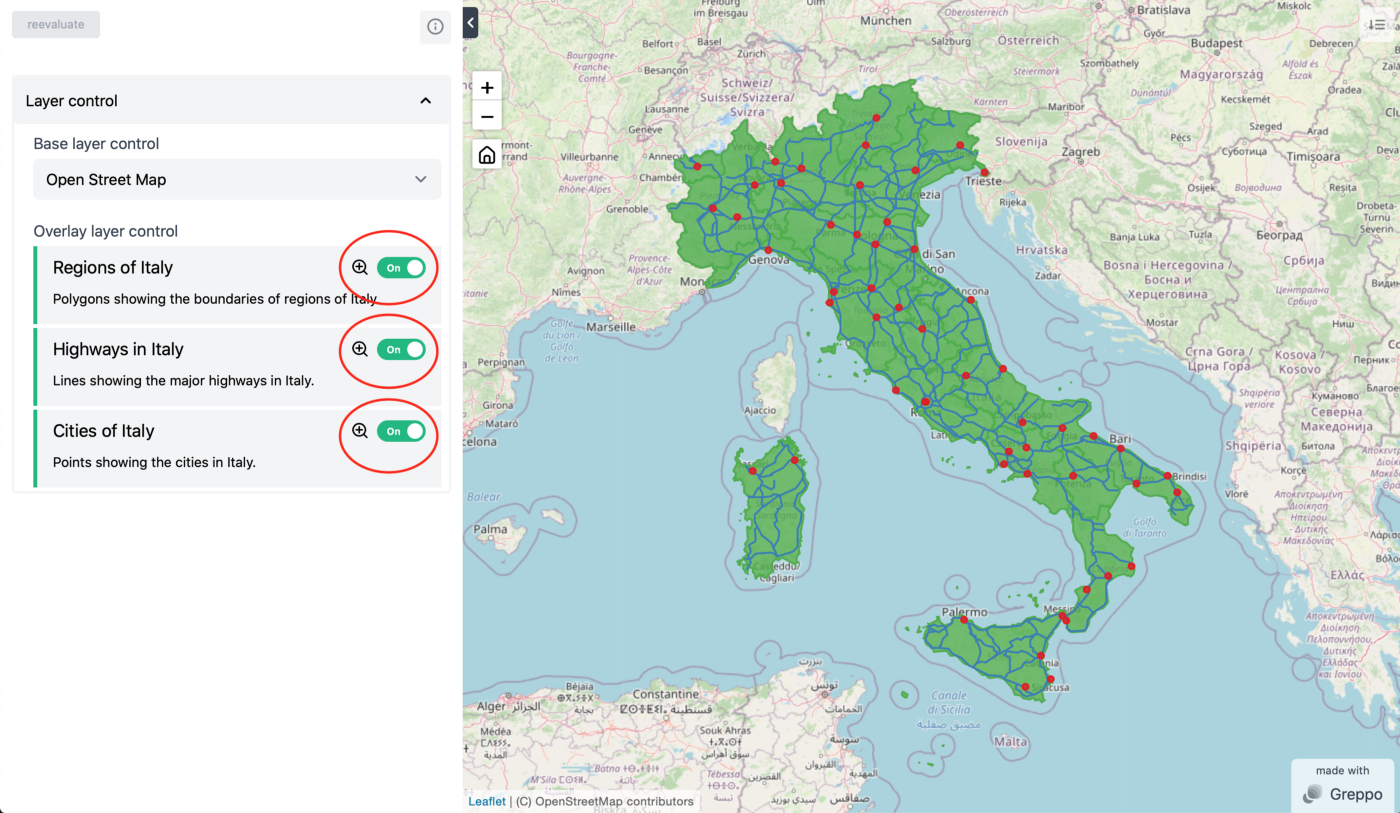
Step 2:导入数据集并将其显示为叠加层。
使用 geopandas,我们可以将矢量数据集作为 GeoDataFrame 导入。 然后可以使用 app.vector_layer() 方法在 Web 应用程序上的地图上对其进行可视化。 在这里,我要导入三个不同的数据集,每个数据集都有多边形(意大利不同地区的边界)、线(意大利的主要高速公路)和点(意大利的主要城市)。
import geopandas as gpd
from greppo import app

regions = gpd.read_file("./regions.geojson")
roads = gpd.read_file("./roads.geojson")
cities = gpd.read_file("./cities.geojson")

app.vector_layer(
    data = regions,
    name = "Regions of Italy",
    description = "Polygons showing the boundaries of regions of Italy.",
    style = {"fillColor": "#4daf4a"},
)

app.vector_layer(
    data = roads,
    name = "Highways in Italy",
    description = "Lines showing the major highways in Italy.",
    style = {"color": "#377eb8"},
)

app.vector_layer(
    data = cities,
    name = "Cities of Italy",
    description = "Points showing the cities in Italy.",
    style = {"color": "#e41a1c"},
    visible = True,
)
使用方法 app.vector_layer() 作为前端的 API,我们可以显示矢量数据。 您需要传入名称,其他参数是可选的。 虽然,将颜色或填充颜色传递给样式是区分和识别每一层的好习惯。 由于前端基于 Leaflet,所有样式都符合 Leaflet 的规范,可以在文档中找到。
您可以在此处找到 vector_layer 和样式的所有信息。 注意:您也可以制作 Choropleth 地图。 可以在此处找到其文档。
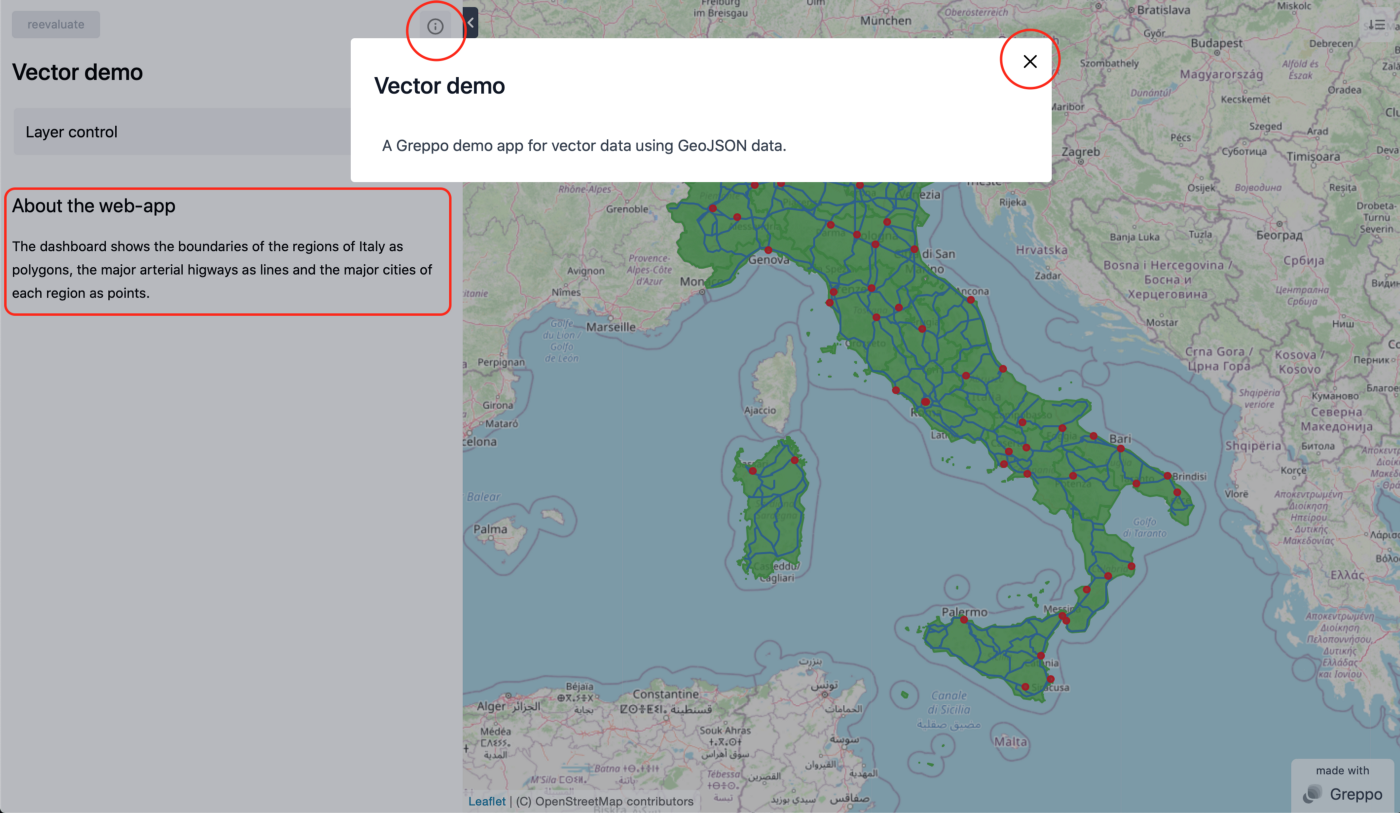
Step 3:显示应用内文本、应用标题和应用描述
为了使 Web 应用程序有用,它需要携带一些文本以向其用户提供一些指导和上下文。 这些可以显示在组件旁边的侧边栏上。 使用 app.display() 方法可以在 web-app 上显示降价文本。 使用相同的方法,可以设置应用程序的标题和描述。
from greppo import app

app.display(name='title', value='Vector demo')
app.display(name='description',
            value='A Greppo demo app for vector data using GeoJSON data.')

text_1 = """
## About the web-app
The dashboard shows the boundaries of the regions of Italy as polygons,
the major arterial higways as lines and the major cities of each region as points.
"""

app.display(name='text-1', value=text_1)
app.display() 接受两个参数 name 和 value 。 虽然 value 承载要显示的文本,但 name 必须是唯一的,并带有文本的标识符。 如果 name=‘title’ 传递的值是应用程序的标题,如果 name=‘description’ 传递的值是应用程序的描述。 如果没有这两者中的任何一个,该应用程序将带有其默认标题和描述。 鼓励设置应用程序的标题和描述。
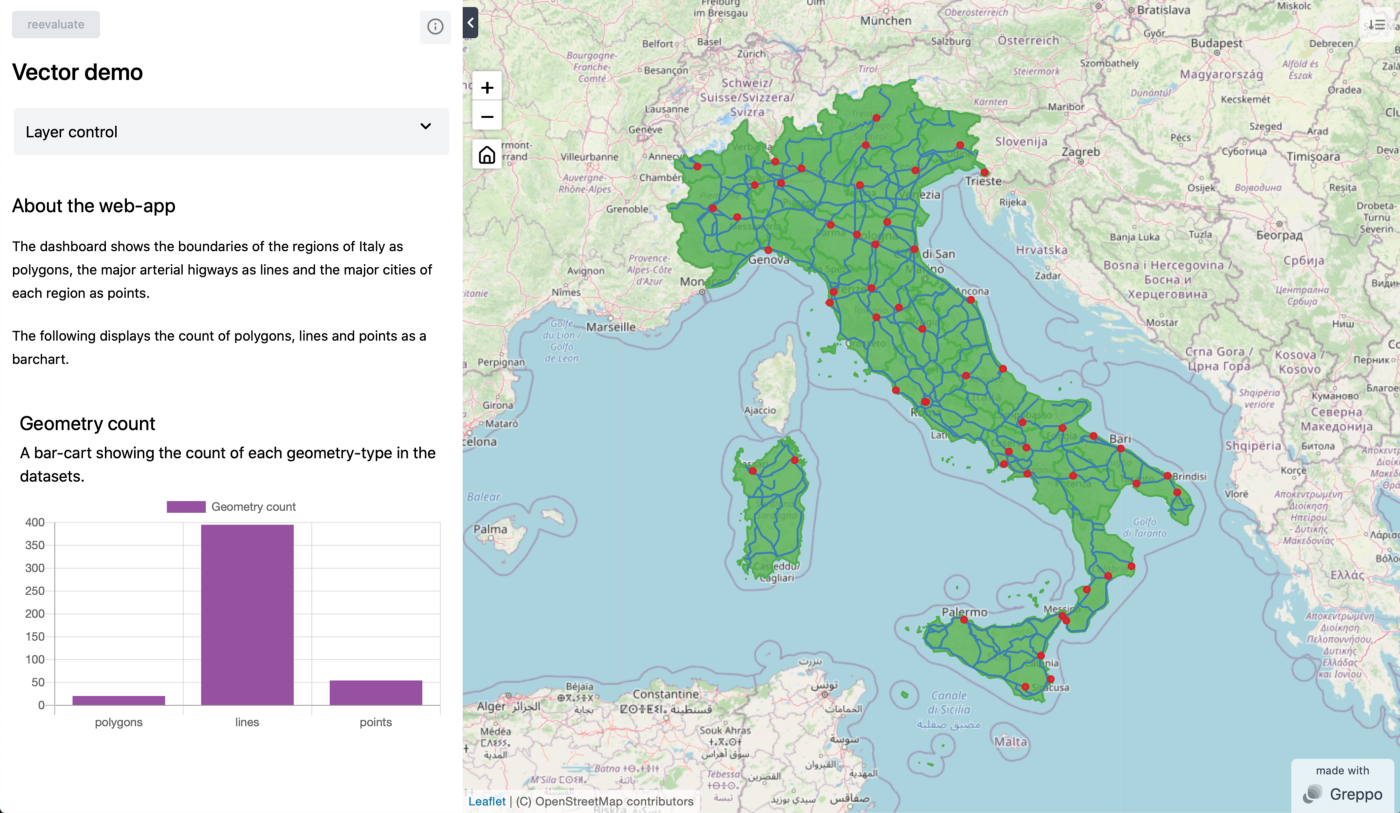
Step 4:将数据显示为图表
数据应用程序几乎没有将数据显示为图表。 Greppo 还允许您将数据显示为图表。 可以在文档中找到有关图表及其用法的信息。 这里,作为一个例子,展示了一个条形图,app.bar_chart()。
from greppo import app
import geopandas as gpd

regions = gpd.read_file("./regions.geojson")
roads = gpd.read_file("./roads.geojson")
cities = gpd.read_file("./cities.geojson")

app.display(name='text-2',
            value='The following displays the count of polygons, lines and points as a barchart.')

app.bar_chart(name='Geometry count', description='A bar-cart showing the count of each geometry-type in the datasets.',
              x=['polygons', 'lines', 'points'], y=[len(regions), len(roads), len(cities)], color='#984ea3')
图表所需的参数是名称、x 和 y 值。 可以添加描述和颜色来为应用程序用户提供更好的上下文。 名称和描述与图表一起显示。
结论
让我们全面了解一下我们在这里所做的事情。 我们的目标是使用 Greppo 创建一个地理空间 web 应用程序,以显示一些 GIS 矢量数据,并添加组件以为应用程序的用户提供更好的上下文。 这是该应用程序的完整代码:
from greppo import app
import geopandas as gpd

app.display(name='title', value='Vector demo')
app.display(name='description',
            value='A Greppo demo app for vector data using GeoJSON data.')

app.base_layer(
    name="Open Street Map",
    visible=True,
    url="https://{s}.tile.openstreetmap.org/{z}/{x}/{y}.png",
    subdomains=None,
    attribution='(C) OpenStreetMap contributors',
)

app.base_layer(
    provider="CartoDB Positron",
)

regions = gpd.read_file("./regions.geojson")
roads = gpd.read_file("./roads.geojson")
cities = gpd.read_file("./cities.geojson")

app.vector_layer(
    data=regions,
    name="Regions of Italy",
    description="Polygons showing the boundaries of regions of Italy.",
    style={"fillColor": "#4daf4a"},
)

app.vector_layer(
    data=roads,
    name="Highways in Italy",
    description="Lines showing the major highways in Italy.",
    style={"color": "#377eb8"},
)

app.vector_layer(
    data=cities,
    name="Cities of Italy",
    description="Points showing the cities in Italy.",
    style={"color": "#e41a1c"},
    visible=True,
)

text_1 = """
## About the web-app

The dashboard shows the boundaries of the regions of Italy as polygons, the
major arterial higways as lines and the major cities of each region as points.
"""

app.display(name='text-1', value=text_1)

app.display(name='text-2',
            value='The following displays the count of polygons, lines and points as a barchart.')

app.bar_chart(name='Geometry count', description='A bar-cart showing the count of each geometry-type in the datasets.',
              x=['polygons', 'lines', 'points'], y=[len(regions), len(roads), len(cities)], color='#984ea3')
运行效果如下
下载项目数据代码
了解课程